• Japan Built a Wall… and a Forest

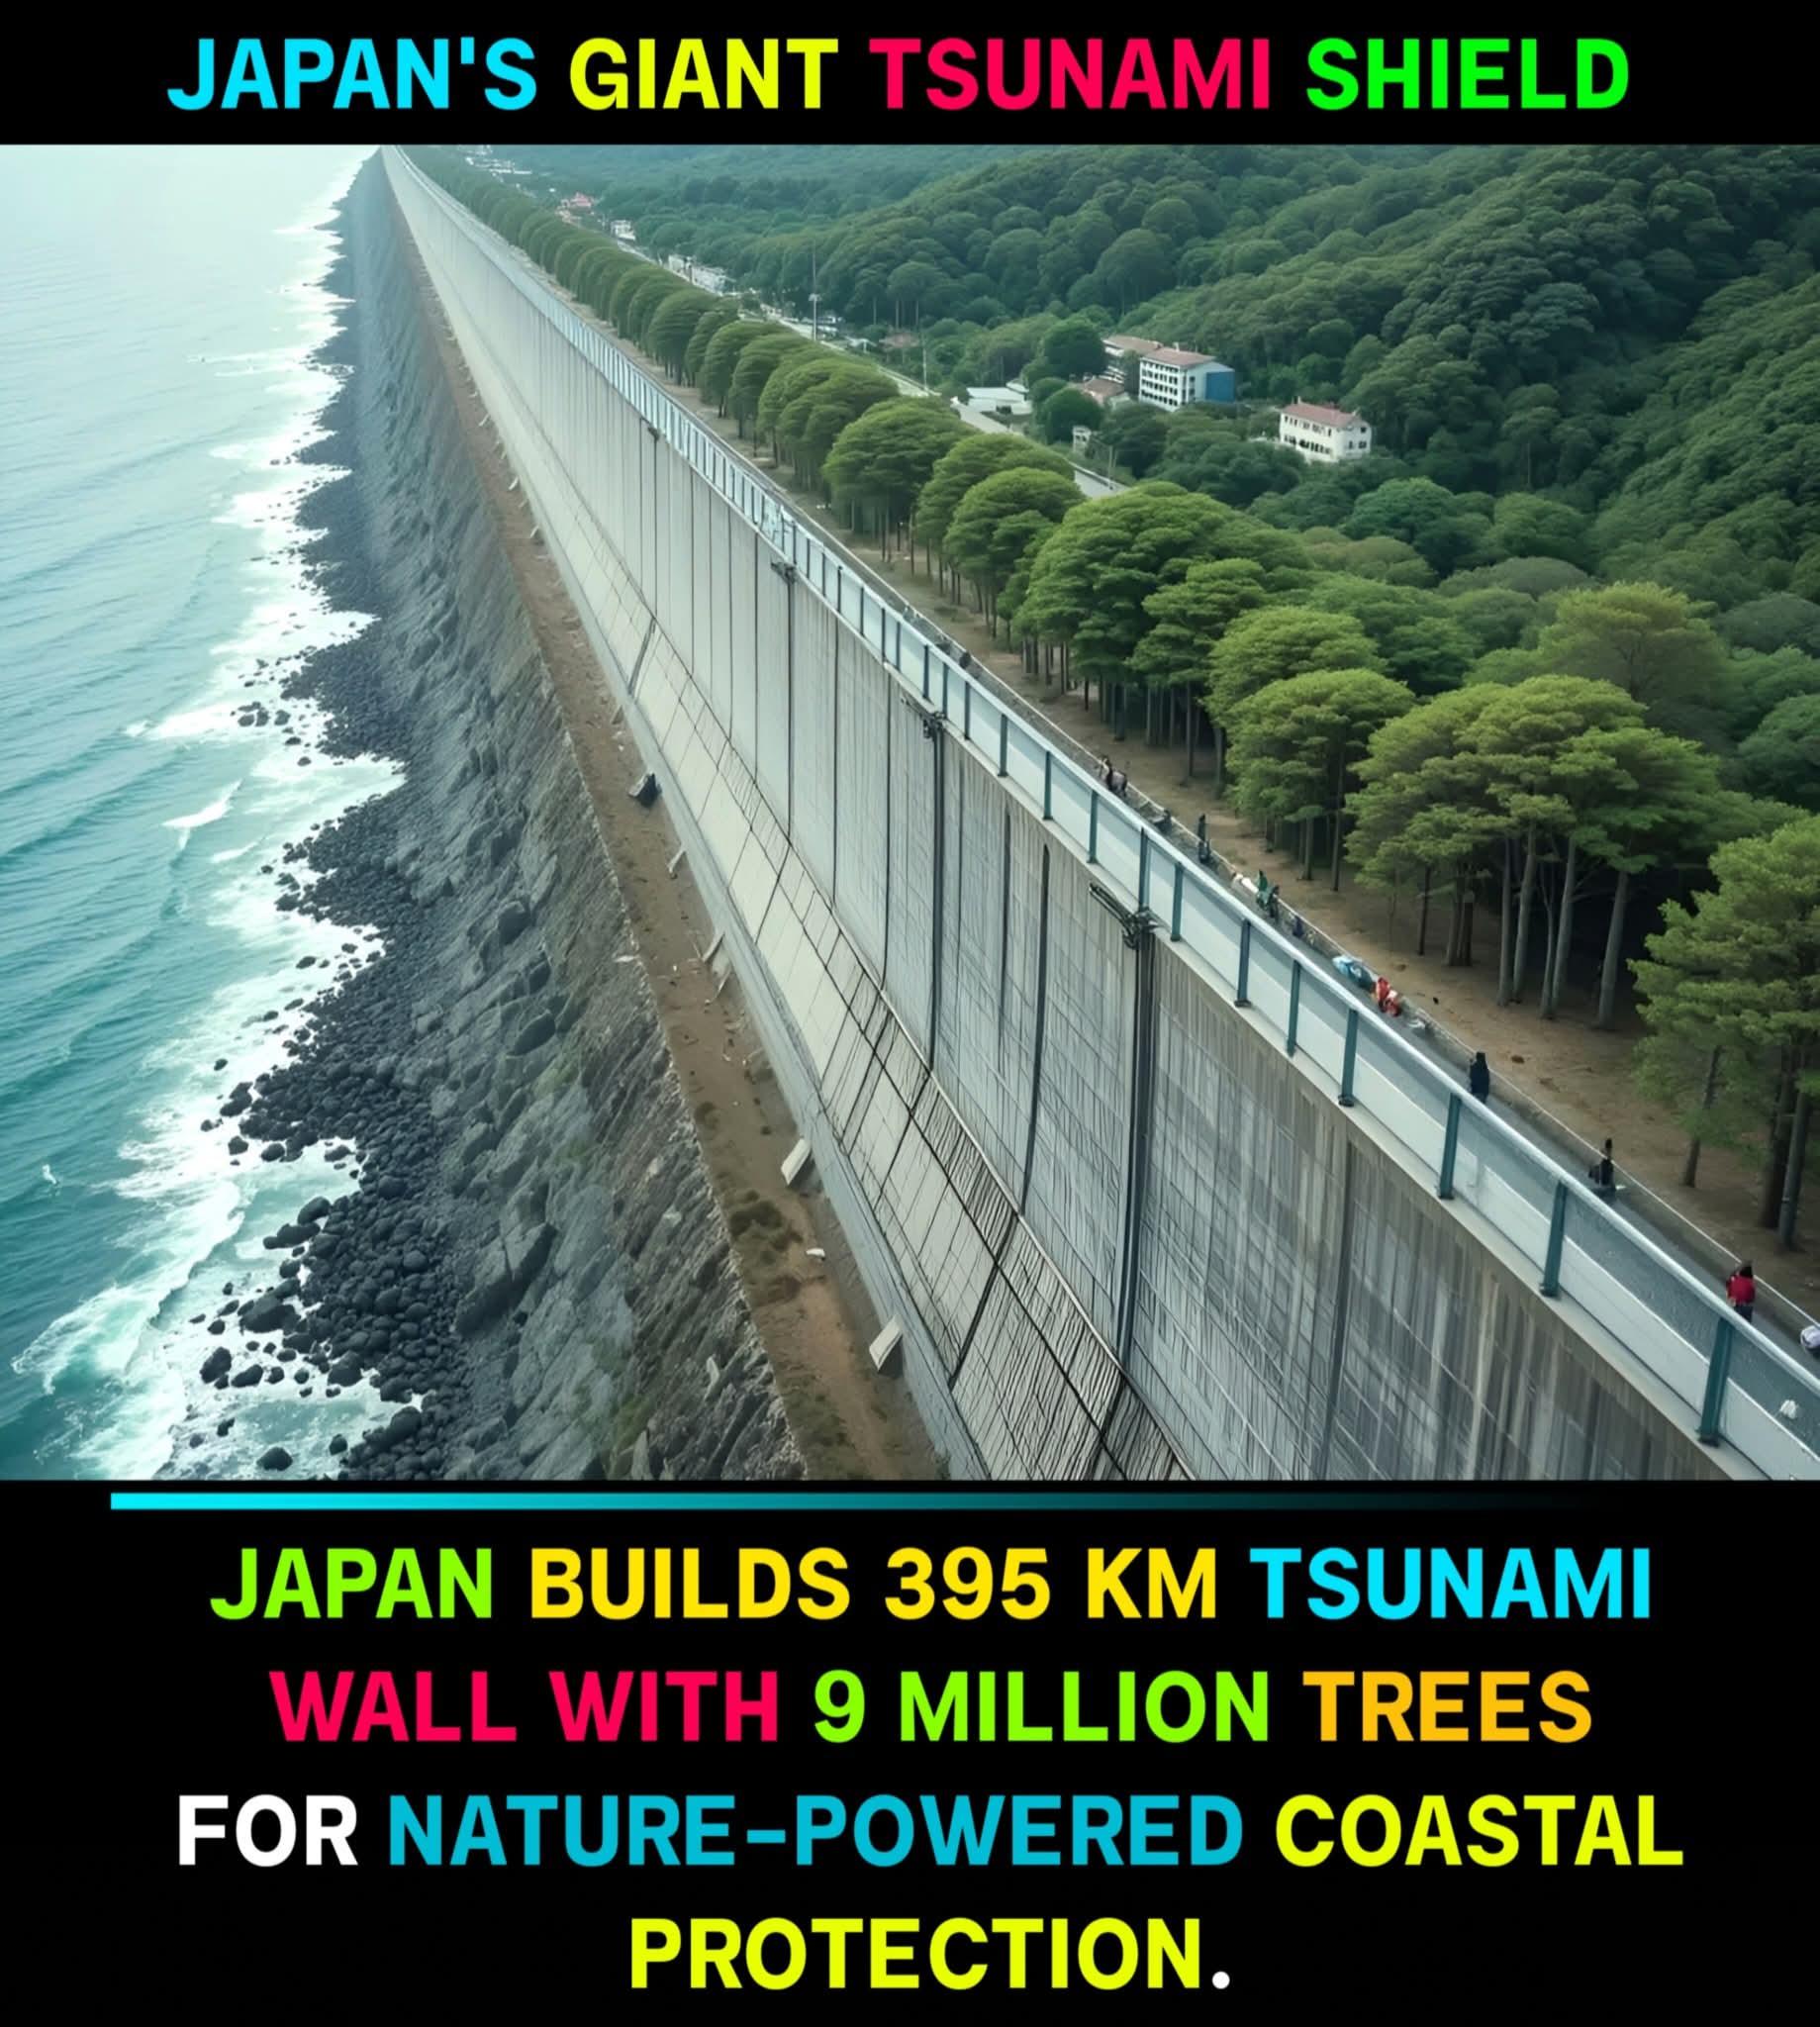
    After the devastating 2011 tsunami, Japan didn’t just rebuild—they went fortress mode.

    Stretching an unbelievable 395 km, the Great Tsunami Wall is a beast of engineering. In some spots, it’s taller than a 4-story building (14.7 meters), with foundations plunging 25 meters deep to hold back the ocean’s fury.

    But here’s the twist—Japan didn’t stop at concrete. They also planted 9 million trees along the coast, creating the “Great Forest Wall.” This living barrier slows incoming waves and traps dangerous debris before it can be dragged back to sea.

    It’s part man-made muscle, part Mother Nature magic—and it’s one of the boldest disaster defenses on Earth.
    🌊 Japan Built a Wall… and a Forest After the devastating 2011 tsunami, Japan didn’t just rebuild—they went fortress mode. Stretching an unbelievable 395 km, the Great Tsunami Wall is a beast of engineering. In some spots, it’s taller than a 4-story building (14.7 meters), with foundations plunging 25 meters deep to hold back the ocean’s fury. But here’s the twist—Japan didn’t stop at concrete. They also planted 9 million trees along the coast, creating the “Great Forest Wall.” This living barrier slows incoming waves and traps dangerous debris before it can be dragged back to sea. It’s part man-made muscle, part Mother Nature magic—and it’s one of the boldest disaster defenses on Earth. 🇯🇵
    0 Commentarios 0 Acciones 550 Views
  • #槍戰​#抗日​#抗戰​#戰術​#功夫大師​#中國功夫​
    #Gunfight​, #Anti​-Japanese War, #Anti​-Japanese War,#Tactics​, #Kung​ Fu Master#Chinese​ Kongfu
    #槍戰​#抗日​#抗戰​#戰術​#功夫大師​#中國功夫​ #Gunfight​, #Anti​-Japanese War, #Anti​-Japanese War,#Tactics​, #Kung​ Fu Master#Chinese​ Kongfu
    0 Commentarios 0 Acciones 475 Views
  • University of Tokyo’s DRAGON Lab developed the world’s first flapping-wing drone capable of safe human contact, inspired by a falcon.

    The bird-like drone uses soft, flexible wings instead of propellers, making it quieter and safer for close interaction.

    It responds to simple hand gestures: bent arm signals “stay,” extended arm means “approach and land.”

    Eight motion-capture cameras track user movements, enabling precise flight planning that maintains 0.3-meter chest distance and approaches from predictable angles.
    The drone’s sophisticated algorithm adjusts velocity based on human motion perception, potentially enabling package delivery and accessibility applications in crowded urban environments.

    © Fossbytes

    #drone #tech #bird #japan
    University of Tokyo’s DRAGON Lab developed the world’s first flapping-wing drone capable of safe human contact, inspired by a falcon. The bird-like drone uses soft, flexible wings instead of propellers, making it quieter and safer for close interaction. It responds to simple hand gestures: bent arm signals “stay,” extended arm means “approach and land.” Eight motion-capture cameras track user movements, enabling precise flight planning that maintains 0.3-meter chest distance and approaches from predictable angles. The drone’s sophisticated algorithm adjusts velocity based on human motion perception, potentially enabling package delivery and accessibility applications in crowded urban environments. © Fossbytes #drone #tech #bird #japan
    0 Commentarios 0 Acciones 424 Views
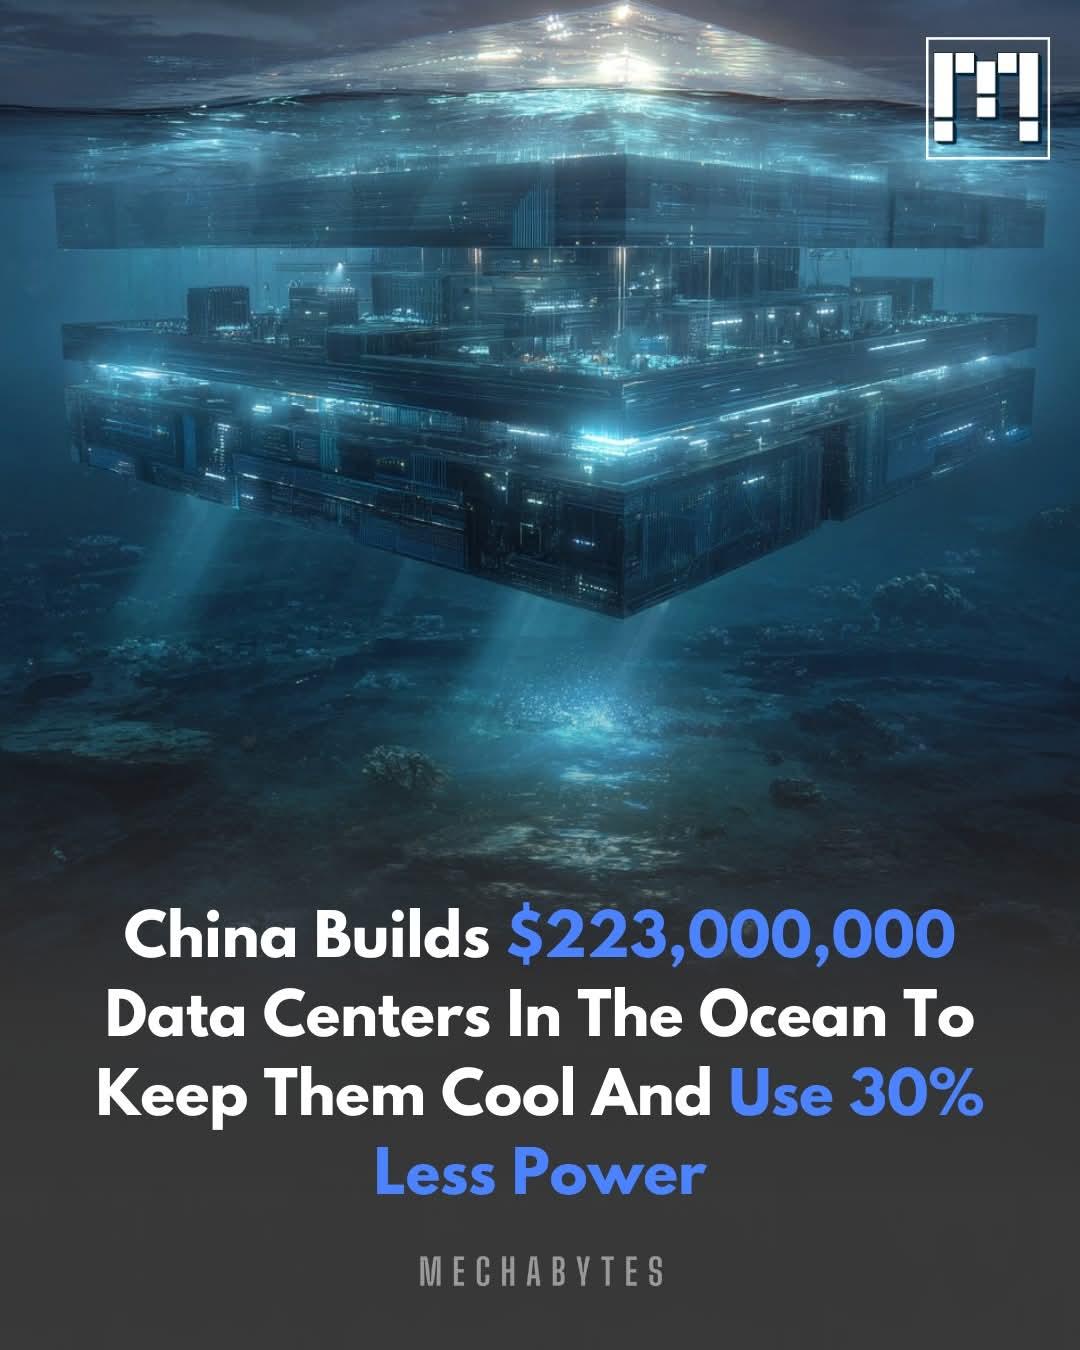
  • China is building underwater data centers that use seawater for cooling and 97% wind energy for power to meet rising AI demand.

    A $223M facility six miles off Shanghai will hold up to 792 AI-capable servers and launch in September.

    It’s expected to train models like GPT-3.5 in a day while using 30% less electricity than land-based centers. Microsoft tested a similar idea with Project Natick in 2018 but shelved it.

    Meanwhile, China is scaling fast. Environmental concerns remain, but South Korea and Japan are already exploring similar offshore data solutions.
    China is building underwater data centers that use seawater for cooling and 97% wind energy for power to meet rising AI demand. A $223M facility six miles off Shanghai will hold up to 792 AI-capable servers and launch in September. It’s expected to train models like GPT-3.5 in a day while using 30% less electricity than land-based centers. Microsoft tested a similar idea with Project Natick in 2018 but shelved it. Meanwhile, China is scaling fast. Environmental concerns remain, but South Korea and Japan are already exploring similar offshore data solutions.
    0 Commentarios 0 Acciones 283 Views
  • This House Literally Floats to Survive Powerful Earthquakes.

    Engineers in Japan are testing a futuristic earthquake defence system that could change how homes are built forever. In a country where tremors strike often and unpredictably, this groundbreaking technology could be the key to protecting lives, property, and peace of mind.

    Developed by Air Danshin Systems, the idea is as bold as it is brilliant. When an earthquake begins, high-speed sensors instantly detect the tremors. In less than a second, powerful air compressors activate, lifting the entire house a few centimetres off the ground using a cushion of compressed air. While the earth shakes beneath it, the home simply floats above the chaos. Once the shaking stops, the house gently returns to its original position, without damage, without stress.

    This technology is drastically different from traditional quake-resistant architecture, which relies on shock absorbers and flexible frames to handle seismic waves. Instead of fighting the movement, these floating homes rise above it entirely.

    The impact could be enormous. Every year, earthquakes cause billions in damage and displace thousands of families. This innovation has the potential to make homes safer, reduce insurance costs, and transform urban planning in quake-prone regions around the world.

    More than just an engineering achievement, this floating house represents a hopeful future where science defends us not only with strength but with grace. It’s a reminder that some of the most powerful solutions are also the most elegant.

    As global climate shifts increase the frequency of natural disasters, breakthroughs like this inspire a world where preparation and innovation walk hand in hand. The earth may move, but we don’t have to fall with it.

    #DiscoverTheUniverse #Discover #EarthquakeInnovation #FloatingHouse #DisasterTech
    This House Literally Floats to Survive Powerful Earthquakes. Engineers in Japan are testing a futuristic earthquake defence system that could change how homes are built forever. In a country where tremors strike often and unpredictably, this groundbreaking technology could be the key to protecting lives, property, and peace of mind. Developed by Air Danshin Systems, the idea is as bold as it is brilliant. When an earthquake begins, high-speed sensors instantly detect the tremors. In less than a second, powerful air compressors activate, lifting the entire house a few centimetres off the ground using a cushion of compressed air. While the earth shakes beneath it, the home simply floats above the chaos. Once the shaking stops, the house gently returns to its original position, without damage, without stress. This technology is drastically different from traditional quake-resistant architecture, which relies on shock absorbers and flexible frames to handle seismic waves. Instead of fighting the movement, these floating homes rise above it entirely. The impact could be enormous. Every year, earthquakes cause billions in damage and displace thousands of families. This innovation has the potential to make homes safer, reduce insurance costs, and transform urban planning in quake-prone regions around the world. More than just an engineering achievement, this floating house represents a hopeful future where science defends us not only with strength but with grace. It’s a reminder that some of the most powerful solutions are also the most elegant. As global climate shifts increase the frequency of natural disasters, breakthroughs like this inspire a world where preparation and innovation walk hand in hand. The earth may move, but we don’t have to fall with it. #DiscoverTheUniverse #Discover #EarthquakeInnovation #FloatingHouse #DisasterTech
    0 Commentarios 0 Acciones 507 Views
  • 感謝您的支持,歡迎訂閱我的頻道
    精彩刺激的槍戰劇正在更新中
    #抗日#抗戰#軍旅
    戰爭 | 特種兵 | 特種部隊 | 軍旅 | 狙击手 | 抗战 | 抗日战争 | 中国 | martial arts | 八路军 | martial arts fight | martial arts movie | Kung Fu | 日军 | fight | 动作 | 历史 | troops | Chinese television dramas | Chinese drama | 中国电视剧 | action | action movies | kung fu movie | eight route army | eight route army movie | 抗日神剧 | Second Sino-Japanese War | 战争剧 | 战争片 | 抗日电视剧 | 抗日剧 | 抗日剧2023 | 抗日战争剧2023
    感謝您的支持,歡迎訂閱我的頻道 精彩刺激的槍戰劇正在更新中 #抗日​ #抗戰​ #軍旅​ 戰爭 | 特種兵 | 特種部隊 | 軍旅 | 狙击手 | 抗战 | 抗日战争 | 中国 | martial arts | 八路军 | martial arts fight | martial arts movie | Kung Fu | 日军 | fight | 动作 | 历史 | troops | Chinese television dramas | Chinese drama | 中国电视剧 | action | action movies | kung fu movie | eight route army | eight route army movie | 抗日神剧 | Second Sino-Japanese War | 战争剧 | 战争片 | 抗日电视剧 | 抗日剧 | 抗日剧2023 | 抗日战争剧2023
    0 Commentarios 0 Acciones 269 Views
  • Action | The legendary Female Samurai challenges the Japanese Empire | Free Full Movie in English 4K
    🎬 Action | The legendary Female Samurai challenges the Japanese Empire | Free Full Movie in English 4K
    0 Commentarios 0 Acciones 109 Views

  • Japan’s newest smart toilets are turning bathroom visits into high-tech health screenings! Equipped with AI, sensors, and urine analysis tools, they examine stool shape, color, and chemistry, then send a detailed health report directly to your phone. No more guesswork—just instant, personalized wellness insights, straight from your toilet. Welcome to the future of bathroom technology!
    Japan’s newest smart toilets are turning bathroom visits into high-tech health screenings! Equipped with AI, sensors, and urine analysis tools, they examine stool shape, color, and chemistry, then send a detailed health report directly to your phone. No more guesswork—just instant, personalized wellness insights, straight from your toilet. Welcome to the future of bathroom technology!
    0 Commentarios 0 Acciones 160 Views
  • It’s one of the most dangerous places on Earth—and yet, many people may not have heard of it.

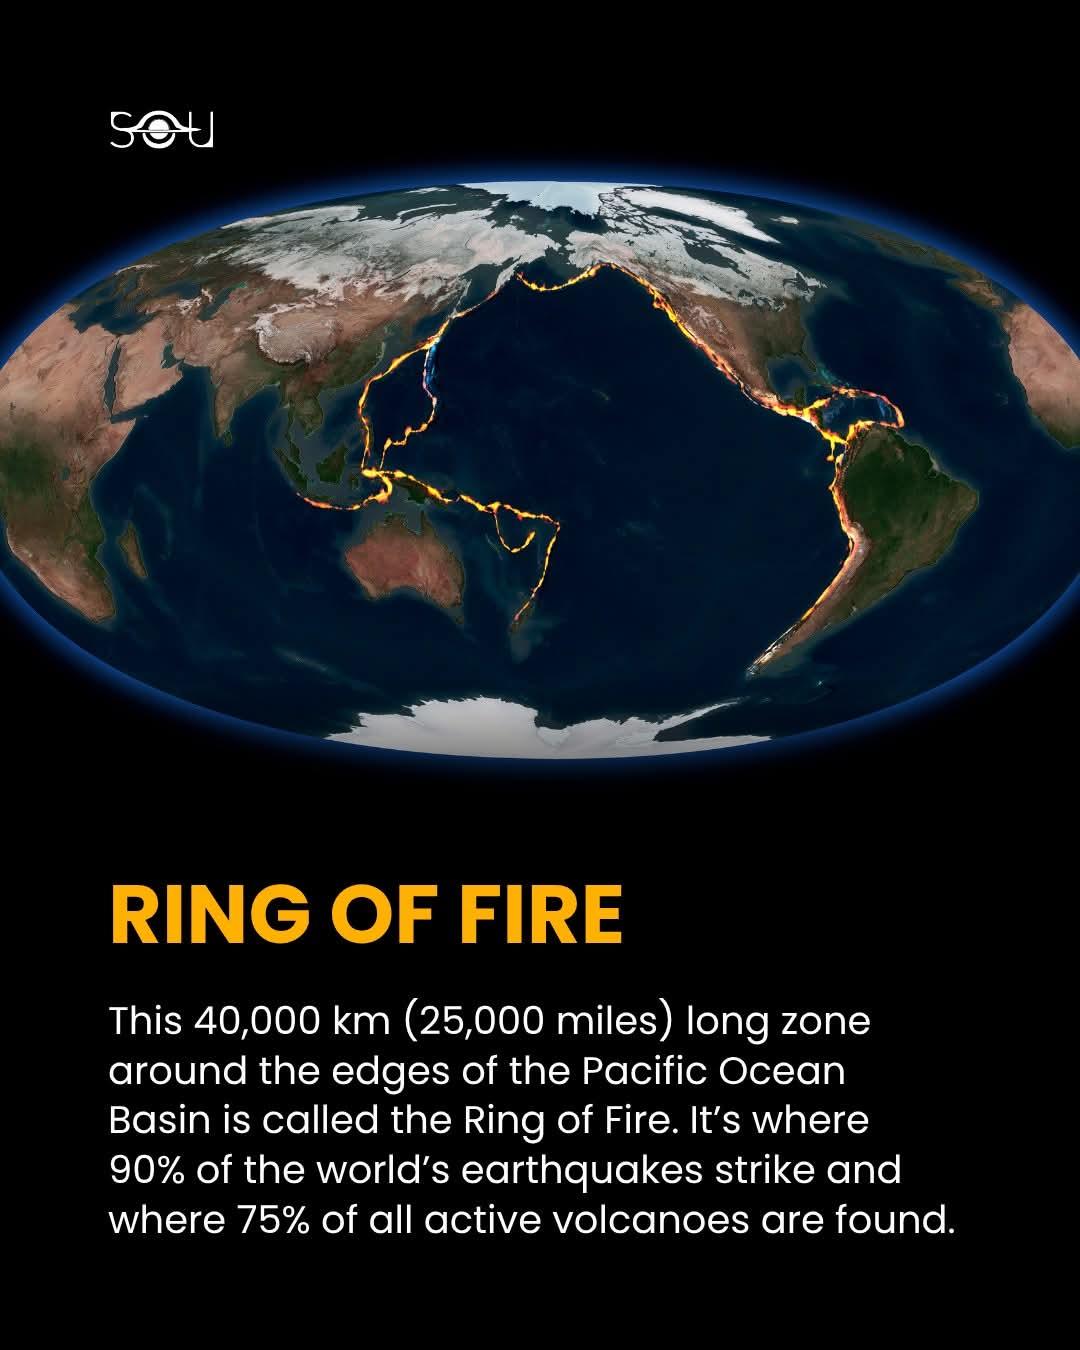
    The Ring of Fire is a horseshoe-shaped belt stretching over 40,000 kilometers around the Pacific Ocean, home to some of Earth’s most intense geological activity.

    This volatile region hosts about 75% of all active volcanoes and experiences nearly 90% of the world’s earthquakes. It runs through countries like Japan, Indonesia, the Philippines, New Zealand, the west coasts of North and South America, and even Antarctica.

    What makes the Ring of Fire so dangerous is the movement of tectonic plates. Here, massive plates of Earth’s crust collide, pull apart, or slide past each other in a slow but constant struggle. Subduction zones—where one plate dives beneath another—generate immense pressure, eventually unleashing it as powerful earthquakes or explosive volcanic eruptions.

    Some of history’s most catastrophic natural disasters have emerged from this region, including the 2011 Japan earthquake and tsunami and the 2004 Indian Ocean tsunami. Yet, the Ring of Fire isn’t just a zone of destruction. Its geothermal energy supports local communities, its volcanic soils nourish rich ecosystems, and its landscapes—like Mount Fuji and Chile’s volcanic fields—are breathtakingly beautiful.

    The Ring of Fire is a dramatic reminder of how alive and dynamic our planet truly is.
    🌋 It’s one of the most dangerous places on Earth—and yet, many people may not have heard of it. The Ring of Fire is a horseshoe-shaped belt stretching over 40,000 kilometers around the Pacific Ocean, home to some of Earth’s most intense geological activity. This volatile region hosts about 75% of all active volcanoes and experiences nearly 90% of the world’s earthquakes. It runs through countries like Japan, Indonesia, the Philippines, New Zealand, the west coasts of North and South America, and even Antarctica. What makes the Ring of Fire so dangerous is the movement of tectonic plates. Here, massive plates of Earth’s crust collide, pull apart, or slide past each other in a slow but constant struggle. Subduction zones—where one plate dives beneath another—generate immense pressure, eventually unleashing it as powerful earthquakes or explosive volcanic eruptions. Some of history’s most catastrophic natural disasters have emerged from this region, including the 2011 Japan earthquake and tsunami and the 2004 Indian Ocean tsunami. Yet, the Ring of Fire isn’t just a zone of destruction. Its geothermal energy supports local communities, its volcanic soils nourish rich ecosystems, and its landscapes—like Mount Fuji and Chile’s volcanic fields—are breathtakingly beautiful. The Ring of Fire is a dramatic reminder of how alive and dynamic our planet truly is.
    0 Commentarios 0 Acciones 193 Views
  • আপনার গবেষণা পদ্ধতির সাতকাহন: লিনিয়ার রিগ্রেশন
    (Linear Regression in Research methodology)

    ধরুন, আপনি অনেকগুলো কাঁচামাল জোগাড় করেছেন। এখন সেই কাঁচামাল দিয়ে কী বানাবেন, কীভাবে বানাবেন, সেটাই হলো বিশ্লেষণের কাজ। আর এই বিশ্লেষণের দুনিয়ায় একটা দারুণ 'ম্যাজিক টুল' আছে, যার নাম লিনিয়ার রিগ্রেশন। এর নামটা একটু জটিল শোনালেও, এর কাজটা কিন্তু খুবই সহজ আর কাজের। চলুন, আজ আমরা এই লিনিয়ার রিগ্রেশনের আদ্যোপান্ত জেনে নিই, একদম A2Z!

    লিনিয়ার রিগ্রেশন আসলে কী? (What is Linear Regression?)
    আচ্ছা, আপনি কি কখনো ভেবে দেখেছেন, একজন শিক্ষার্থী যত বেশি সময় পড়াশোনা করে, তার পরীক্ষার নম্বর তত বাড়ে কেন? অথবা, একটি পণ্যের দাম বাড়লে তার বিক্রি কমে যায় কেন? এই 'কেন' আর 'কীভাবে'র সম্পর্কটা খুঁজে বের করার জন্যই লিনিয়ার রিগ্রেশনকে আমরা ব্যবহার করি।

    সহজ করে বললে, লিনিয়ার রিগ্রেশন হলো এমন একটি পরিসংখ্যানগত কৌশল, যা দুটি বা তার বেশি বিষয়ের মধ্যে একটা সরলরেখার মতো সম্পর্ক খুঁজে বের করতে সাহায্য করে। এটি অনেকটা একটা অদৃশ্য সুতো খুঁজে বের করার মতো, যা দুটি জিনিসকে একসঙ্গে বেঁধে রাখে। যেমন, পড়াশোনার সময় আর পরীক্ষার নম্বরের মধ্যে একটা সম্পর্ক আছে, তাই না? লিনিয়ার রিগ্রেশন সেই সম্পর্কটাকে একটা সরলরেখা দিয়ে প্রকাশ করে।

    এখানে দুটো গুরুত্বপূর্ণ খেলোয়াড় আছে, যাদেরকে আমরা 'চলক' (Variables) বলি:

    ১। স্বাধীন চলক (Independent Variable): এই হলো সেই 'কারণ' বা 'ইনপুট'। একে আপনি পরিবর্তন করতে পারেন, বা এটি নিজে নিজেই পরিবর্তিত হয় এবং অন্য কোনো কিছুকে প্রভাবিত করে। যেমন, পড়াশোনার সময়, বিজ্ঞাপনের খরচ, বা একটি বাড়ির আকার। ভাবুন তো, পড়াশোনার সময় বাড়লে বা কমলে পরীক্ষার নম্বরের ওপর একটা প্রভাব পড়ে, তাই না?

    ২। নির্ভরশীল চলক (Dependent Variable): আর এই হলো সেই 'ফলাফল' বা 'আউটপুট', যা স্বাধীন চলকের পরিবর্তনের কারণে প্রভাবিত হয়। যেমন, পরীক্ষার নম্বর, পণ্যের বিক্রি, বা বাড়ির দাম। এই চলকটি স্বাধীন চলকের উপর 'নির্ভর' করে।

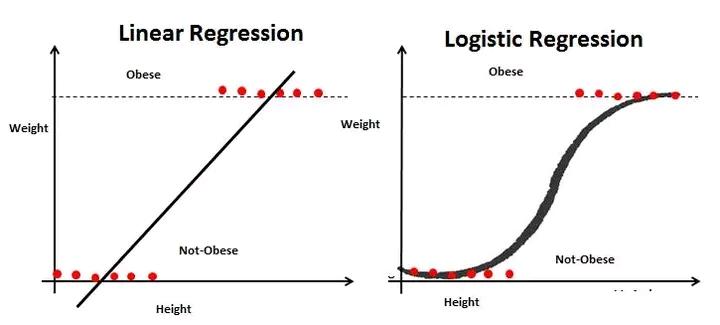
    লিনিয়ার রিগ্রেশনের মূল লক্ষ্য হলো এই স্বাধীন ও নির্ভরশীল চলকের মধ্যে একটা গাণিতিক সম্পর্ক খুঁজে বের করা, যা দেখতে একটা সরলরেখার মতো। এই রেখার একটা সমীকরণ থাকে: Y=a+bX

    এখানে: Y হলো নির্ভরশীল চলক (ফলাফল): অর্থাৎ, আপনি যে জিনিসটা অনুমান করতে চান বা যার পরিবর্তন মাপতে চান।

    X হলো স্বাধীন চলক (কারণ): অর্থাৎ, যে জিনিসটা পরিবর্তনের কারণ হিসেবে কাজ করছে।

    a হলো ইন্টারসেপ্ট (Intercept): এটি অনেকটা গ্রাফের Y-অক্ষকে রেখাটি যেখানে ছেদ করে সেই বিন্দু। সহজ ভাষায়, যখন স্বাধীন চলক (X) এর মান শূন্য হয়, তখন নির্ভরশীল চলক (Y) এর আনুমানিক মান কত হবে, সেটাই a। যেমন, যদি আপনি একদমই পড়াশোনা না করেন (X=0), তাহলে আপনার পরীক্ষার নম্বর কত হতে পারে, তার একটা আনুমানিক ধারণা।

    b হলো স্লপ (Slope): এটি রেখার ঢাল বা খাড়া হওয়ার পরিমাণ নির্দেশ করে। এটি দেখায়, স্বাধীন চলক (X) এর মান যখন এক ইউনিট বাড়ে, তখন নির্ভরশীল চলক (Y) এর মান কতটুকু পরিবর্তন হয়। যেমন, যদি b এর মান ২ হয়, তার মানে পড়াশোনার সময় এক ঘণ্টা বাড়ালে পরীক্ষার নম্বর আনুমানিক ২ বাড়বে।

    কেন আমরা লিনিয়ার রিগ্রেশন ব্যবহার করি? (Why Use It?)

    এর প্রধান কাজ দুটো, যা গবেষণায় দারুণ কাজে আসে:
    A) সম্পর্ক বোঝা (Understanding Relationships): এটি আপনাকে বলে দেবে, আপনার চলকগুলোর মধ্যে আদৌ কোনো সম্পর্ক আছে কি না, এবং সেই সম্পর্কটা কতটা শক্তিশালী। ধরুন, আপনি জানতে চান, বিজ্ঞাপনে খরচ বাড়ালে পণ্যের বিক্রি কি সত্যিই বাড়ে? যদি বাড়ে, তাহলে কতটা বাড়ে? লিনিয়ার রিগ্রেশন আপনাকে এই 'কতটা'র একটা সংখ্যাগত পরিমাপ দেবে।

    B) ভবিষ্যৎ অনুমান করা (Making Predictions): একবার সম্পর্কটা বুঝে গেলে, আমরা ভবিষ্যৎ সম্পর্কে কিছু অনুমান করতে পারি। ধরুন, আপনি দেখলেন যে, তাপমাত্রা বাড়লে আইসক্রিমের বিক্রি বাড়ে। লিনিয়ার রিগ্রেশন আপনাকে একটি মডেল দেবে, যার মাধ্যমে আপনি হয়তো বলতে পারবেন, আগামী সপ্তাহে তাপমাত্রা যদি আরও বাড়ে, তাহলে আইসক্রিমের বিক্রি কেমন হতে পারে। এটি অনেকটা আবহাওয়ার পূর্বাভাস দেওয়ার মতো, যেখানে আমরা অতীতের ডেটা ব্যবহার করে ভবিষ্যতের একটা ধারণা পাই।

    লিনিয়ার রিগ্রেশন কীভাবে কাজ করে? (How Does It Work?)
    লিনিয়ার রিগ্রেশন কাজ করে একটা সরলরেখা ব্যবহার করে। ভাবুন, আপনার কাছে কিছু ডেটা পয়েন্ট আছে, যেমন গ্রাফ পেপারে ছড়ানো কিছু বিন্দু। লিনিয়ার রিগ্রেশনের কাজ হলো এই বিন্দুগুলোর মাঝখান দিয়ে এমন একটা সরলরেখা আঁকা, যা সব বিন্দু থেকে 'গড়ে' সবচেয়ে কম দূরত্বে থাকে। এই 'সবচেয়ে কম দূরত্ব' খুঁজে বের করার জন্য কিছু গাণিতিক হিসাব-নিকাশ করা হয়, যাকে আমরা 'এরর মিনিমাইজেশন' বা 'অবশিষ্ট কমানো' বলি। অর্থাৎ, ডেটা পয়েন্টগুলো থেকে রেখার যে দূরত্ব, সেই দূরত্বগুলোকে যতটা সম্ভব ছোট করা হয়, যাতে রেখাটি ডেটার 'প্রবণতা' বা 'ট্রেন্ড'কে সবচেয়ে ভালোভাবে দেখাতে পারে। এই রেখাটিই হলো আপনার রিগ্রেশন লাইন, যা আপনার ডেটার গল্পটা বলে।

    লিনিয়ার রিগ্রেশনের প্রকারভেদ (Types of Linear Regression)
    লিনিয়ার রিগ্রেশন মূলত দুটি প্রধান ধরনে বিভক্ত, নির্ভর করে আপনি কতগুলো স্বাধীন চলক ব্যবহার করছেন তার উপর:

    সাধারণ লিনিয়ার রিগ্রেশন (Simple Linear Regression): এখানে শুধু একটি স্বাধীন চলক এবং একটি নির্ভরশীল চলক থাকে।

    উদাহরণ: একজন ছাত্রের পড়াশোনার সময়ের (স্বাধীন চলক) সাথে তার পরীক্ষার নম্বরের (নির্ভরশীল চলক) সম্পর্ক। এখানে আপনি শুধু একটি কারণ (পড়াশোনার সময়) দিয়ে একটি ফলাফল (পরীক্ষার নম্বর) বোঝার চেষ্টা করছেন।

    মাল্টিপল লিনিয়ার রিগ্রেশন (Multiple Linear Regression): এখানে একাধিক স্বাধীন চলক এবং একটি নির্ভরশীল চলক থাকে।

    উদাহরণ: একটি বাড়ির দাম (নির্ভরশীল চলক) শুধু তার আকারের উপর নির্ভর করে না, বরং এলাকার অবস্থান, বাড়ির বয়স, রুমের সংখ্যা, বাথরুমের সংখ্যা – এই সবকিছুর উপর নির্ভর করে। মাল্টিপল রিগ্রেশন এই সব কারণ একসঙ্গে বিশ্লেষণ করে দেখায় যে, কোন কারণটি বাড়ির দামের উপর কতটা প্রভাব ফেলছে। এটি অনেকটা অনেকগুলো কারণ একসঙ্গে একটি ফলাফলের উপর কীভাবে প্রভাব ফেলে, তা দেখার মতো।

    কিছু জরুরি কথা (Key Concepts): অবশিষ্ট (Residuals): রিগ্রেশন রেখাটি সব ডেটা পয়েন্টের উপর দিয়ে যায় না, কিছু পয়েন্ট রেখার উপরে বা নিচে থাকে। এই ডেটা পয়েন্ট এবং রেখার মধ্যে যে দূরত্ব, সেটিই হলো অবশিষ্ট বা এরর (error)। এটি দেখায়, আমাদের মডেল কতটা নিখুঁতভাবে অনুমান করতে পারছে। যত কম অবশিষ্ট, মডেল তত ভালো।

    সহসম্পর্ক (Correlation): এটি লিনিয়ার রিগ্রেশনের সাথে জড়িত একটি ধারণা। সহসম্পর্ক (যেমন পিয়ারসন কোরিলেশন কোএফিশিয়েন্ট) দুটি চলকের মধ্যে সম্পর্কের শক্তি এবং দিক (ইতিবাচক বা নেতিবাচক) পরিমাপ করে। লিনিয়ার রিগ্রেশন এই সম্পর্ককে একটি মডেলের মাধ্যমে ব্যাখ্যা করে। সহসম্পর্ক আপনাকে বলবে সম্পর্ক আছে কিনা, আর রিগ্রেশন আপনাকে বলবে সেই সম্পর্কটা কেমন এবং কীভাবে কাজ করে।

    অনুমান (Assumptions): লিনিয়ার রিগ্রেশন কিছু নির্দিষ্ট শর্তের উপর ভিত্তি করে কাজ করে। যেমন, চলকগুলোর মধ্যে সম্পর্কটা যেন সত্যিই সরলরৈখিক হয়, ডেটা পয়েন্টগুলো যেন খুব বেশি ছড়ানো-ছিটানো না থাকে (আউটলায়ার না থাকে), এবং এররগুলো যেন এলোমেলোভাবে ছড়ানো থাকে। এই শর্তগুলো পূরণ হলে মডেলের ফলাফল আরও নির্ভরযোগ্য হয়।

    কখন ব্যবহার করবেন, কখন করবেন না? (When to Use, When Not to Use?)

    কখন ব্যবহার করবেন?: যখন আপনি দুটি বা তার বেশি চলকের মধ্যে একটি সরলরৈখিক সম্পর্ক আছে বলে মনে করেন এবং সেই সম্পর্কটা বুঝতে চান। যখন আপনি একটি চলকের মান ব্যবহার করে অন্য একটি চলকের মান অনুমান করতে চান।

    যখন আপনি জানতে চান, কোন কারণগুলো (স্বাধীন চলক) একটি নির্দিষ্ট ফলাফলের (নির্ভরশীল চলক) উপর সবচেয়ে বেশি প্রভাব ফেলছে। যখন আপনি কোনো ধারাবাহিক ফলাফল (continuous outcome) যেমন, তাপমাত্রা, বিক্রি, নম্বর ইত্যাদি অনুমান করতে চান।

    কখন করবেন না?
    যদি চলকগুলোর মধ্যে কোনো সরলরৈখিক সম্পর্ক না থাকে (যেমন, সম্পর্কটি বক্ররেখার মতো বা এলোমেলো)। এক্ষেত্রে অন্য ধরনের রিগ্রেশন মডেল ব্যবহার করতে হতে পারে। যদি আপনার ডেটায় অনেক বেশি অস্বাভাবিক বা ভুল ডেটা (outliers) থাকে, যা রেখাটিকে ভুলভাবে প্রভাবিত করতে পারে। এই 'আউটলায়ার'গুলো ফলাফলকে ভুল পথে চালিত করতে পারে।

    যদি আপনার স্বাধীন চলকগুলো একে অপরের সাথে খুব বেশি সম্পর্কিত হয় (multicollinearity), তাহলে মাল্টিপল রিগ্রেশন ব্যবহার করা কঠিন হতে পারে। এটি অনেকটা এমন যে, দুটি কারণ একই রকম প্রভাব ফেলছে, তখন বোঝা কঠিন হয়ে যায় কোনটি আসল প্রভাবক।

    লিনিয়ার রিগ্রেশন হলো ডেটা বিশ্লেষণের এক দারুণ হাতিয়ার, যা আপনাকে ডেটার ভেতরের লুকানো গল্পগুলো খুঁজে বের করতে সাহায্য করবে। এটি শুধু সংখ্যা নয়, বরং সংখ্যার পেছনের কারণ ও প্রভাবকে বুঝতে শেখায়। আশা করি, এই বিস্তারিত আলোচনা আপনার লিনিয়ার রিগ্রেশন সম্পর্কে ধারণা আরও পরিষ্কার করেছে। আপনার যদি আরও কিছু জানার থাকে, তাহলে আমাকে জানাতে পারেন!

    Md. Rony Masud
    BBA, MBA (DU), MS (Japan)
    আপনার গবেষণা পদ্ধতির সাতকাহন: লিনিয়ার রিগ্রেশন (Linear Regression in Research methodology) ধরুন, আপনি অনেকগুলো কাঁচামাল জোগাড় করেছেন। এখন সেই কাঁচামাল দিয়ে কী বানাবেন, কীভাবে বানাবেন, সেটাই হলো বিশ্লেষণের কাজ। আর এই বিশ্লেষণের দুনিয়ায় একটা দারুণ 'ম্যাজিক টুল' আছে, যার নাম লিনিয়ার রিগ্রেশন। এর নামটা একটু জটিল শোনালেও, এর কাজটা কিন্তু খুবই সহজ আর কাজের। চলুন, আজ আমরা এই লিনিয়ার রিগ্রেশনের আদ্যোপান্ত জেনে নিই, একদম A2Z! লিনিয়ার রিগ্রেশন আসলে কী? (What is Linear Regression?) আচ্ছা, আপনি কি কখনো ভেবে দেখেছেন, একজন শিক্ষার্থী যত বেশি সময় পড়াশোনা করে, তার পরীক্ষার নম্বর তত বাড়ে কেন? অথবা, একটি পণ্যের দাম বাড়লে তার বিক্রি কমে যায় কেন? এই 'কেন' আর 'কীভাবে'র সম্পর্কটা খুঁজে বের করার জন্যই লিনিয়ার রিগ্রেশনকে আমরা ব্যবহার করি। সহজ করে বললে, লিনিয়ার রিগ্রেশন হলো এমন একটি পরিসংখ্যানগত কৌশল, যা দুটি বা তার বেশি বিষয়ের মধ্যে একটা সরলরেখার মতো সম্পর্ক খুঁজে বের করতে সাহায্য করে। এটি অনেকটা একটা অদৃশ্য সুতো খুঁজে বের করার মতো, যা দুটি জিনিসকে একসঙ্গে বেঁধে রাখে। যেমন, পড়াশোনার সময় আর পরীক্ষার নম্বরের মধ্যে একটা সম্পর্ক আছে, তাই না? লিনিয়ার রিগ্রেশন সেই সম্পর্কটাকে একটা সরলরেখা দিয়ে প্রকাশ করে। এখানে দুটো গুরুত্বপূর্ণ খেলোয়াড় আছে, যাদেরকে আমরা 'চলক' (Variables) বলি: ১। স্বাধীন চলক (Independent Variable): এই হলো সেই 'কারণ' বা 'ইনপুট'। একে আপনি পরিবর্তন করতে পারেন, বা এটি নিজে নিজেই পরিবর্তিত হয় এবং অন্য কোনো কিছুকে প্রভাবিত করে। যেমন, পড়াশোনার সময়, বিজ্ঞাপনের খরচ, বা একটি বাড়ির আকার। ভাবুন তো, পড়াশোনার সময় বাড়লে বা কমলে পরীক্ষার নম্বরের ওপর একটা প্রভাব পড়ে, তাই না? ২। নির্ভরশীল চলক (Dependent Variable): আর এই হলো সেই 'ফলাফল' বা 'আউটপুট', যা স্বাধীন চলকের পরিবর্তনের কারণে প্রভাবিত হয়। যেমন, পরীক্ষার নম্বর, পণ্যের বিক্রি, বা বাড়ির দাম। এই চলকটি স্বাধীন চলকের উপর 'নির্ভর' করে। লিনিয়ার রিগ্রেশনের মূল লক্ষ্য হলো এই স্বাধীন ও নির্ভরশীল চলকের মধ্যে একটা গাণিতিক সম্পর্ক খুঁজে বের করা, যা দেখতে একটা সরলরেখার মতো। এই রেখার একটা সমীকরণ থাকে: Y=a+bX এখানে: Y হলো নির্ভরশীল চলক (ফলাফল): অর্থাৎ, আপনি যে জিনিসটা অনুমান করতে চান বা যার পরিবর্তন মাপতে চান। X হলো স্বাধীন চলক (কারণ): অর্থাৎ, যে জিনিসটা পরিবর্তনের কারণ হিসেবে কাজ করছে। a হলো ইন্টারসেপ্ট (Intercept): এটি অনেকটা গ্রাফের Y-অক্ষকে রেখাটি যেখানে ছেদ করে সেই বিন্দু। সহজ ভাষায়, যখন স্বাধীন চলক (X) এর মান শূন্য হয়, তখন নির্ভরশীল চলক (Y) এর আনুমানিক মান কত হবে, সেটাই a। যেমন, যদি আপনি একদমই পড়াশোনা না করেন (X=0), তাহলে আপনার পরীক্ষার নম্বর কত হতে পারে, তার একটা আনুমানিক ধারণা। b হলো স্লপ (Slope): এটি রেখার ঢাল বা খাড়া হওয়ার পরিমাণ নির্দেশ করে। এটি দেখায়, স্বাধীন চলক (X) এর মান যখন এক ইউনিট বাড়ে, তখন নির্ভরশীল চলক (Y) এর মান কতটুকু পরিবর্তন হয়। যেমন, যদি b এর মান ২ হয়, তার মানে পড়াশোনার সময় এক ঘণ্টা বাড়ালে পরীক্ষার নম্বর আনুমানিক ২ বাড়বে। কেন আমরা লিনিয়ার রিগ্রেশন ব্যবহার করি? (Why Use It?) এর প্রধান কাজ দুটো, যা গবেষণায় দারুণ কাজে আসে: A) সম্পর্ক বোঝা (Understanding Relationships): এটি আপনাকে বলে দেবে, আপনার চলকগুলোর মধ্যে আদৌ কোনো সম্পর্ক আছে কি না, এবং সেই সম্পর্কটা কতটা শক্তিশালী। ধরুন, আপনি জানতে চান, বিজ্ঞাপনে খরচ বাড়ালে পণ্যের বিক্রি কি সত্যিই বাড়ে? যদি বাড়ে, তাহলে কতটা বাড়ে? লিনিয়ার রিগ্রেশন আপনাকে এই 'কতটা'র একটা সংখ্যাগত পরিমাপ দেবে। B) ভবিষ্যৎ অনুমান করা (Making Predictions): একবার সম্পর্কটা বুঝে গেলে, আমরা ভবিষ্যৎ সম্পর্কে কিছু অনুমান করতে পারি। ধরুন, আপনি দেখলেন যে, তাপমাত্রা বাড়লে আইসক্রিমের বিক্রি বাড়ে। লিনিয়ার রিগ্রেশন আপনাকে একটি মডেল দেবে, যার মাধ্যমে আপনি হয়তো বলতে পারবেন, আগামী সপ্তাহে তাপমাত্রা যদি আরও বাড়ে, তাহলে আইসক্রিমের বিক্রি কেমন হতে পারে। এটি অনেকটা আবহাওয়ার পূর্বাভাস দেওয়ার মতো, যেখানে আমরা অতীতের ডেটা ব্যবহার করে ভবিষ্যতের একটা ধারণা পাই। লিনিয়ার রিগ্রেশন কীভাবে কাজ করে? (How Does It Work?) লিনিয়ার রিগ্রেশন কাজ করে একটা সরলরেখা ব্যবহার করে। ভাবুন, আপনার কাছে কিছু ডেটা পয়েন্ট আছে, যেমন গ্রাফ পেপারে ছড়ানো কিছু বিন্দু। লিনিয়ার রিগ্রেশনের কাজ হলো এই বিন্দুগুলোর মাঝখান দিয়ে এমন একটা সরলরেখা আঁকা, যা সব বিন্দু থেকে 'গড়ে' সবচেয়ে কম দূরত্বে থাকে। এই 'সবচেয়ে কম দূরত্ব' খুঁজে বের করার জন্য কিছু গাণিতিক হিসাব-নিকাশ করা হয়, যাকে আমরা 'এরর মিনিমাইজেশন' বা 'অবশিষ্ট কমানো' বলি। অর্থাৎ, ডেটা পয়েন্টগুলো থেকে রেখার যে দূরত্ব, সেই দূরত্বগুলোকে যতটা সম্ভব ছোট করা হয়, যাতে রেখাটি ডেটার 'প্রবণতা' বা 'ট্রেন্ড'কে সবচেয়ে ভালোভাবে দেখাতে পারে। এই রেখাটিই হলো আপনার রিগ্রেশন লাইন, যা আপনার ডেটার গল্পটা বলে। লিনিয়ার রিগ্রেশনের প্রকারভেদ (Types of Linear Regression) লিনিয়ার রিগ্রেশন মূলত দুটি প্রধান ধরনে বিভক্ত, নির্ভর করে আপনি কতগুলো স্বাধীন চলক ব্যবহার করছেন তার উপর: সাধারণ লিনিয়ার রিগ্রেশন (Simple Linear Regression): এখানে শুধু একটি স্বাধীন চলক এবং একটি নির্ভরশীল চলক থাকে। উদাহরণ: একজন ছাত্রের পড়াশোনার সময়ের (স্বাধীন চলক) সাথে তার পরীক্ষার নম্বরের (নির্ভরশীল চলক) সম্পর্ক। এখানে আপনি শুধু একটি কারণ (পড়াশোনার সময়) দিয়ে একটি ফলাফল (পরীক্ষার নম্বর) বোঝার চেষ্টা করছেন। মাল্টিপল লিনিয়ার রিগ্রেশন (Multiple Linear Regression): এখানে একাধিক স্বাধীন চলক এবং একটি নির্ভরশীল চলক থাকে। উদাহরণ: একটি বাড়ির দাম (নির্ভরশীল চলক) শুধু তার আকারের উপর নির্ভর করে না, বরং এলাকার অবস্থান, বাড়ির বয়স, রুমের সংখ্যা, বাথরুমের সংখ্যা – এই সবকিছুর উপর নির্ভর করে। মাল্টিপল রিগ্রেশন এই সব কারণ একসঙ্গে বিশ্লেষণ করে দেখায় যে, কোন কারণটি বাড়ির দামের উপর কতটা প্রভাব ফেলছে। এটি অনেকটা অনেকগুলো কারণ একসঙ্গে একটি ফলাফলের উপর কীভাবে প্রভাব ফেলে, তা দেখার মতো। কিছু জরুরি কথা (Key Concepts): অবশিষ্ট (Residuals): রিগ্রেশন রেখাটি সব ডেটা পয়েন্টের উপর দিয়ে যায় না, কিছু পয়েন্ট রেখার উপরে বা নিচে থাকে। এই ডেটা পয়েন্ট এবং রেখার মধ্যে যে দূরত্ব, সেটিই হলো অবশিষ্ট বা এরর (error)। এটি দেখায়, আমাদের মডেল কতটা নিখুঁতভাবে অনুমান করতে পারছে। যত কম অবশিষ্ট, মডেল তত ভালো। সহসম্পর্ক (Correlation): এটি লিনিয়ার রিগ্রেশনের সাথে জড়িত একটি ধারণা। সহসম্পর্ক (যেমন পিয়ারসন কোরিলেশন কোএফিশিয়েন্ট) দুটি চলকের মধ্যে সম্পর্কের শক্তি এবং দিক (ইতিবাচক বা নেতিবাচক) পরিমাপ করে। লিনিয়ার রিগ্রেশন এই সম্পর্ককে একটি মডেলের মাধ্যমে ব্যাখ্যা করে। সহসম্পর্ক আপনাকে বলবে সম্পর্ক আছে কিনা, আর রিগ্রেশন আপনাকে বলবে সেই সম্পর্কটা কেমন এবং কীভাবে কাজ করে। অনুমান (Assumptions): লিনিয়ার রিগ্রেশন কিছু নির্দিষ্ট শর্তের উপর ভিত্তি করে কাজ করে। যেমন, চলকগুলোর মধ্যে সম্পর্কটা যেন সত্যিই সরলরৈখিক হয়, ডেটা পয়েন্টগুলো যেন খুব বেশি ছড়ানো-ছিটানো না থাকে (আউটলায়ার না থাকে), এবং এররগুলো যেন এলোমেলোভাবে ছড়ানো থাকে। এই শর্তগুলো পূরণ হলে মডেলের ফলাফল আরও নির্ভরযোগ্য হয়। কখন ব্যবহার করবেন, কখন করবেন না? (When to Use, When Not to Use?) কখন ব্যবহার করবেন?: যখন আপনি দুটি বা তার বেশি চলকের মধ্যে একটি সরলরৈখিক সম্পর্ক আছে বলে মনে করেন এবং সেই সম্পর্কটা বুঝতে চান। যখন আপনি একটি চলকের মান ব্যবহার করে অন্য একটি চলকের মান অনুমান করতে চান। যখন আপনি জানতে চান, কোন কারণগুলো (স্বাধীন চলক) একটি নির্দিষ্ট ফলাফলের (নির্ভরশীল চলক) উপর সবচেয়ে বেশি প্রভাব ফেলছে। যখন আপনি কোনো ধারাবাহিক ফলাফল (continuous outcome) যেমন, তাপমাত্রা, বিক্রি, নম্বর ইত্যাদি অনুমান করতে চান। কখন করবেন না? যদি চলকগুলোর মধ্যে কোনো সরলরৈখিক সম্পর্ক না থাকে (যেমন, সম্পর্কটি বক্ররেখার মতো বা এলোমেলো)। এক্ষেত্রে অন্য ধরনের রিগ্রেশন মডেল ব্যবহার করতে হতে পারে। যদি আপনার ডেটায় অনেক বেশি অস্বাভাবিক বা ভুল ডেটা (outliers) থাকে, যা রেখাটিকে ভুলভাবে প্রভাবিত করতে পারে। এই 'আউটলায়ার'গুলো ফলাফলকে ভুল পথে চালিত করতে পারে। যদি আপনার স্বাধীন চলকগুলো একে অপরের সাথে খুব বেশি সম্পর্কিত হয় (multicollinearity), তাহলে মাল্টিপল রিগ্রেশন ব্যবহার করা কঠিন হতে পারে। এটি অনেকটা এমন যে, দুটি কারণ একই রকম প্রভাব ফেলছে, তখন বোঝা কঠিন হয়ে যায় কোনটি আসল প্রভাবক। লিনিয়ার রিগ্রেশন হলো ডেটা বিশ্লেষণের এক দারুণ হাতিয়ার, যা আপনাকে ডেটার ভেতরের লুকানো গল্পগুলো খুঁজে বের করতে সাহায্য করবে। এটি শুধু সংখ্যা নয়, বরং সংখ্যার পেছনের কারণ ও প্রভাবকে বুঝতে শেখায়। আশা করি, এই বিস্তারিত আলোচনা আপনার লিনিয়ার রিগ্রেশন সম্পর্কে ধারণা আরও পরিষ্কার করেছে। আপনার যদি আরও কিছু জানার থাকে, তাহলে আমাকে জানাতে পারেন! Md. Rony Masud BBA, MBA (DU), MS (Japan)
    0 Commentarios 0 Acciones 261 Views
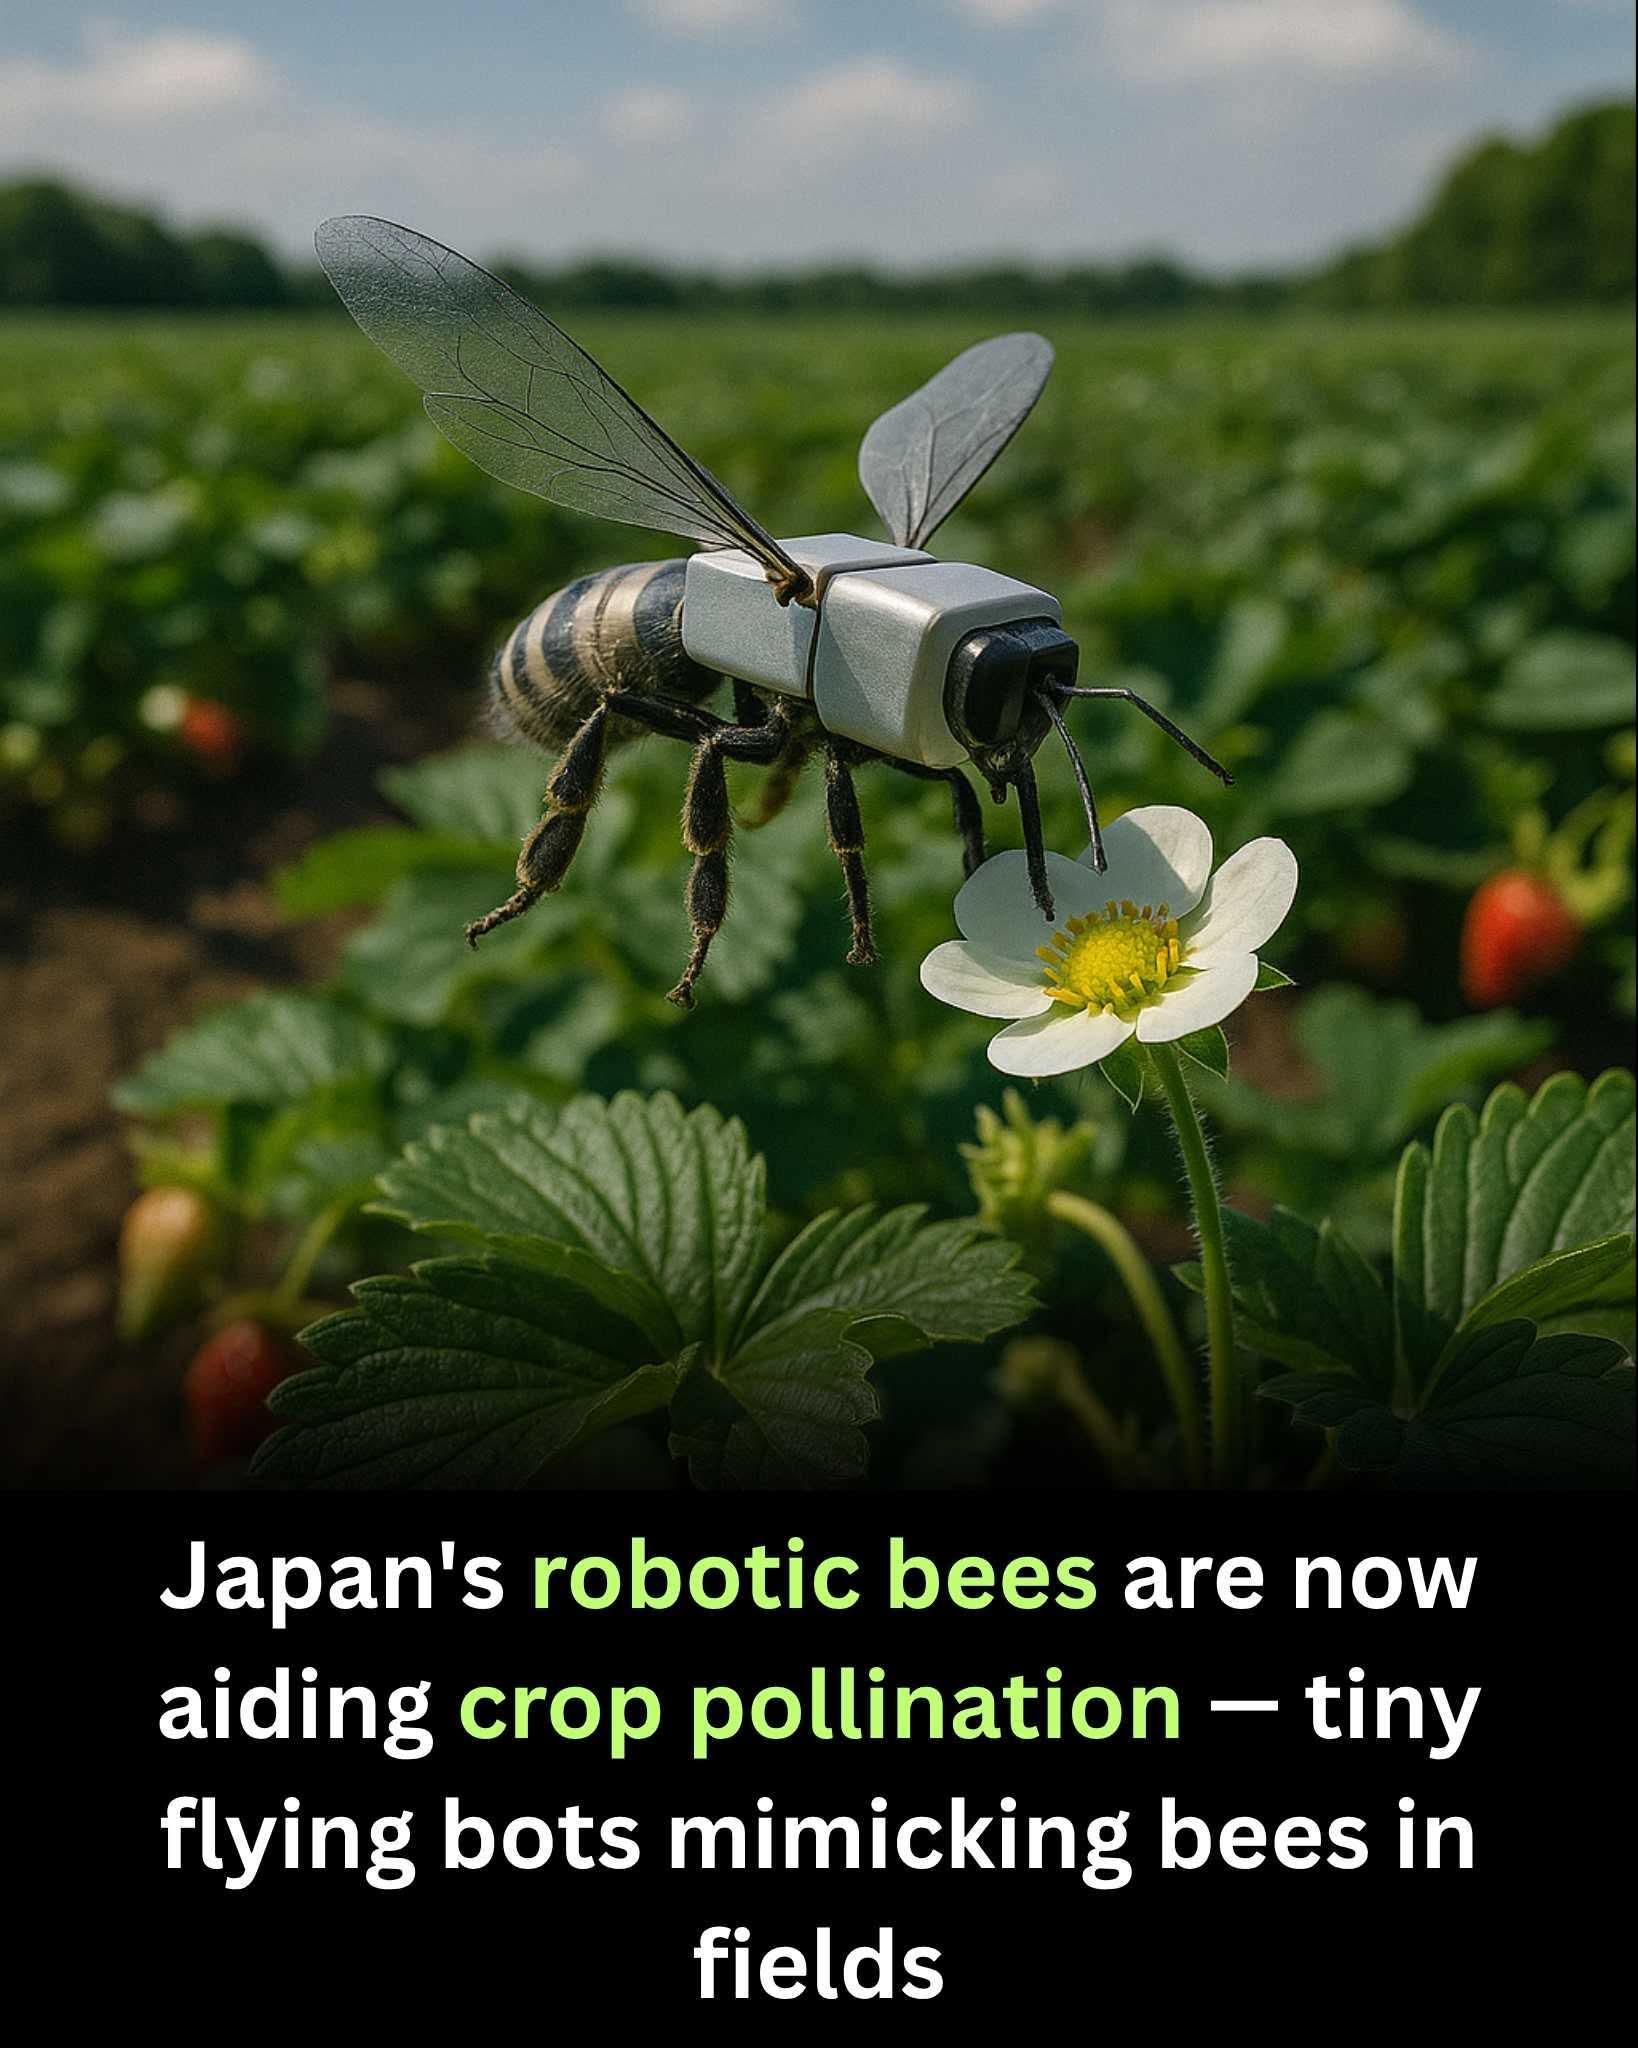
  • Japan has developed robotic bees to help with crop pollination, addressing the global decline in bee populations. These tiny flying bots, equipped with cameras, sensors, and soft horsehair coated in a sticky gel, mimic the natural pollination process of real bees. Guided by AI, they can identify flowers, collect pollen, and transfer it efficiently between plants.

    The robotic bees are being tested in greenhouses and open fields, ensuring crops like fruits and vegetables receive proper pollination even when natural bee numbers are low. Their lightweight design allows them to hover and navigate complex floral patterns without damaging delicate plants.

    This innovation could safeguard global food production, especially in regions facing severe pollinator shortages. By blending robotics with nature’s design, Japan is offering a futuristic yet practical solution to one of agriculture’s biggest challenges.

    #AgriTech #BeeBots #FutureFarming
    Japan has developed robotic bees to help with crop pollination, addressing the global decline in bee populations. These tiny flying bots, equipped with cameras, sensors, and soft horsehair coated in a sticky gel, mimic the natural pollination process of real bees. Guided by AI, they can identify flowers, collect pollen, and transfer it efficiently between plants. The robotic bees are being tested in greenhouses and open fields, ensuring crops like fruits and vegetables receive proper pollination even when natural bee numbers are low. Their lightweight design allows them to hover and navigate complex floral patterns without damaging delicate plants. This innovation could safeguard global food production, especially in regions facing severe pollinator shortages. By blending robotics with nature’s design, Japan is offering a futuristic yet practical solution to one of agriculture’s biggest challenges. #AgriTech #BeeBots #FutureFarming
    0 Commentarios 0 Acciones 313 Views
  • A quake so powerful, it shook the entire Pacific.

    It all began on July 30, at ~11:24 a.m. PETT (23:24 UTC Jul 29) when a powerful 8.8 magnitude earthquake struck off Russia’s Kamchatka Peninsula, unleashing tsunami waves that raced across the Pacific at jet-like speeds. From Japan to Hawaii, Chile to California, coastlines went on high alert.

    The quake originated about 118 kilometers southeast of Petropavlovsk-Kamchatsky, at a depth of approximately 19 kilometers. It was initially reported as magnitude 8.0 but later upgraded to 8.8—placing it among the six strongest earthquakes ever recorded.

    This wasn’t just a regional event. It set off a tsunami that raced across the Pacific Ocean, prompting tsunami warnings for over 40 countries across four continents. That level of global alert hasn't been seen since the 2004 Indian Ocean tsunami—but even then, the warnings weren’t as Pacific-wide.

    This quake occurred in the Kuril-Kamchatka Trench, where the Pacific Plate dives beneath the Okhotsk Plate. It’s part of the Pacific Ring of Fire, Earth’s most seismically active zone. Because the earthquake was shallow and along a subduction zone, it violently displaced the seafloor—pushing a massive wall of water outward in all directions.

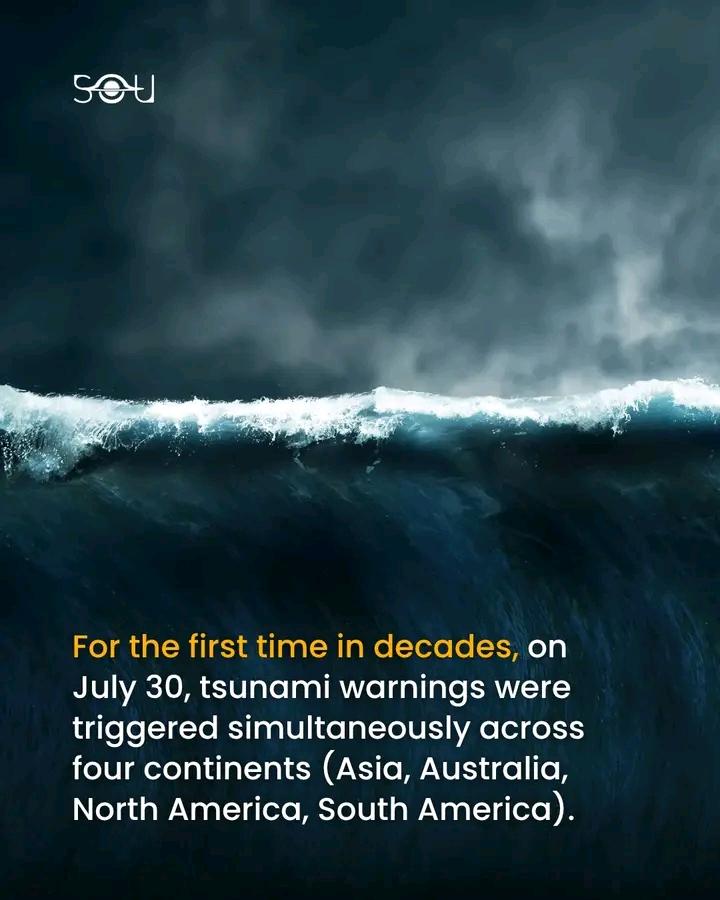
    This was the first time in decades that tsunami alerts were issued across Asia, Oceania, North America, and South America simultaneously. In total, over 100 million people were placed under some form of tsunami advisory or warning.

    The earthquake triggered dozens of aftershocks, including one measuring 6.9, further heightening concerns of secondary quakes or tsunamis. Fortunately, due to improved global early warning systems developed after previous disasters, mass casualties were largely avoided.
    🌍 A quake so powerful, it shook the entire Pacific. It all began on July 30, at ~11:24 a.m. PETT (23:24 UTC Jul 29) when a powerful 8.8 magnitude earthquake struck off Russia’s Kamchatka Peninsula, unleashing tsunami waves that raced across the Pacific at jet-like speeds. From Japan to Hawaii, Chile to California, coastlines went on high alert. The quake originated about 118 kilometers southeast of Petropavlovsk-Kamchatsky, at a depth of approximately 19 kilometers. It was initially reported as magnitude 8.0 but later upgraded to 8.8—placing it among the six strongest earthquakes ever recorded. This wasn’t just a regional event. It set off a tsunami that raced across the Pacific Ocean, prompting tsunami warnings for over 40 countries across four continents. That level of global alert hasn't been seen since the 2004 Indian Ocean tsunami—but even then, the warnings weren’t as Pacific-wide. This quake occurred in the Kuril-Kamchatka Trench, where the Pacific Plate dives beneath the Okhotsk Plate. It’s part of the Pacific Ring of Fire, Earth’s most seismically active zone. Because the earthquake was shallow and along a subduction zone, it violently displaced the seafloor—pushing a massive wall of water outward in all directions. This was the first time in decades that tsunami alerts were issued across Asia, Oceania, North America, and South America simultaneously. In total, over 100 million people were placed under some form of tsunami advisory or warning. The earthquake triggered dozens of aftershocks, including one measuring 6.9, further heightening concerns of secondary quakes or tsunamis. Fortunately, due to improved global early warning systems developed after previous disasters, mass casualties were largely avoided.
    0 Commentarios 0 Acciones 193 Views
Resultados de la búsqueda
BlackBird Ai
https://bbai.shop